Infographics
From quarterly market reports to interactive editorials and anniversary campaigns, these projects demonstrate how thoughtful information design can transform dense research and datasets into clear, engaging visual stories. Working closely with analysts, copywriters, and subject matter experts, I helped translate complex data into accessible experiences that informed, engaged, and extended the reach of PitchBook's content.
Role: Creative Direction and Design Lead
Venture Monitor
Challenge
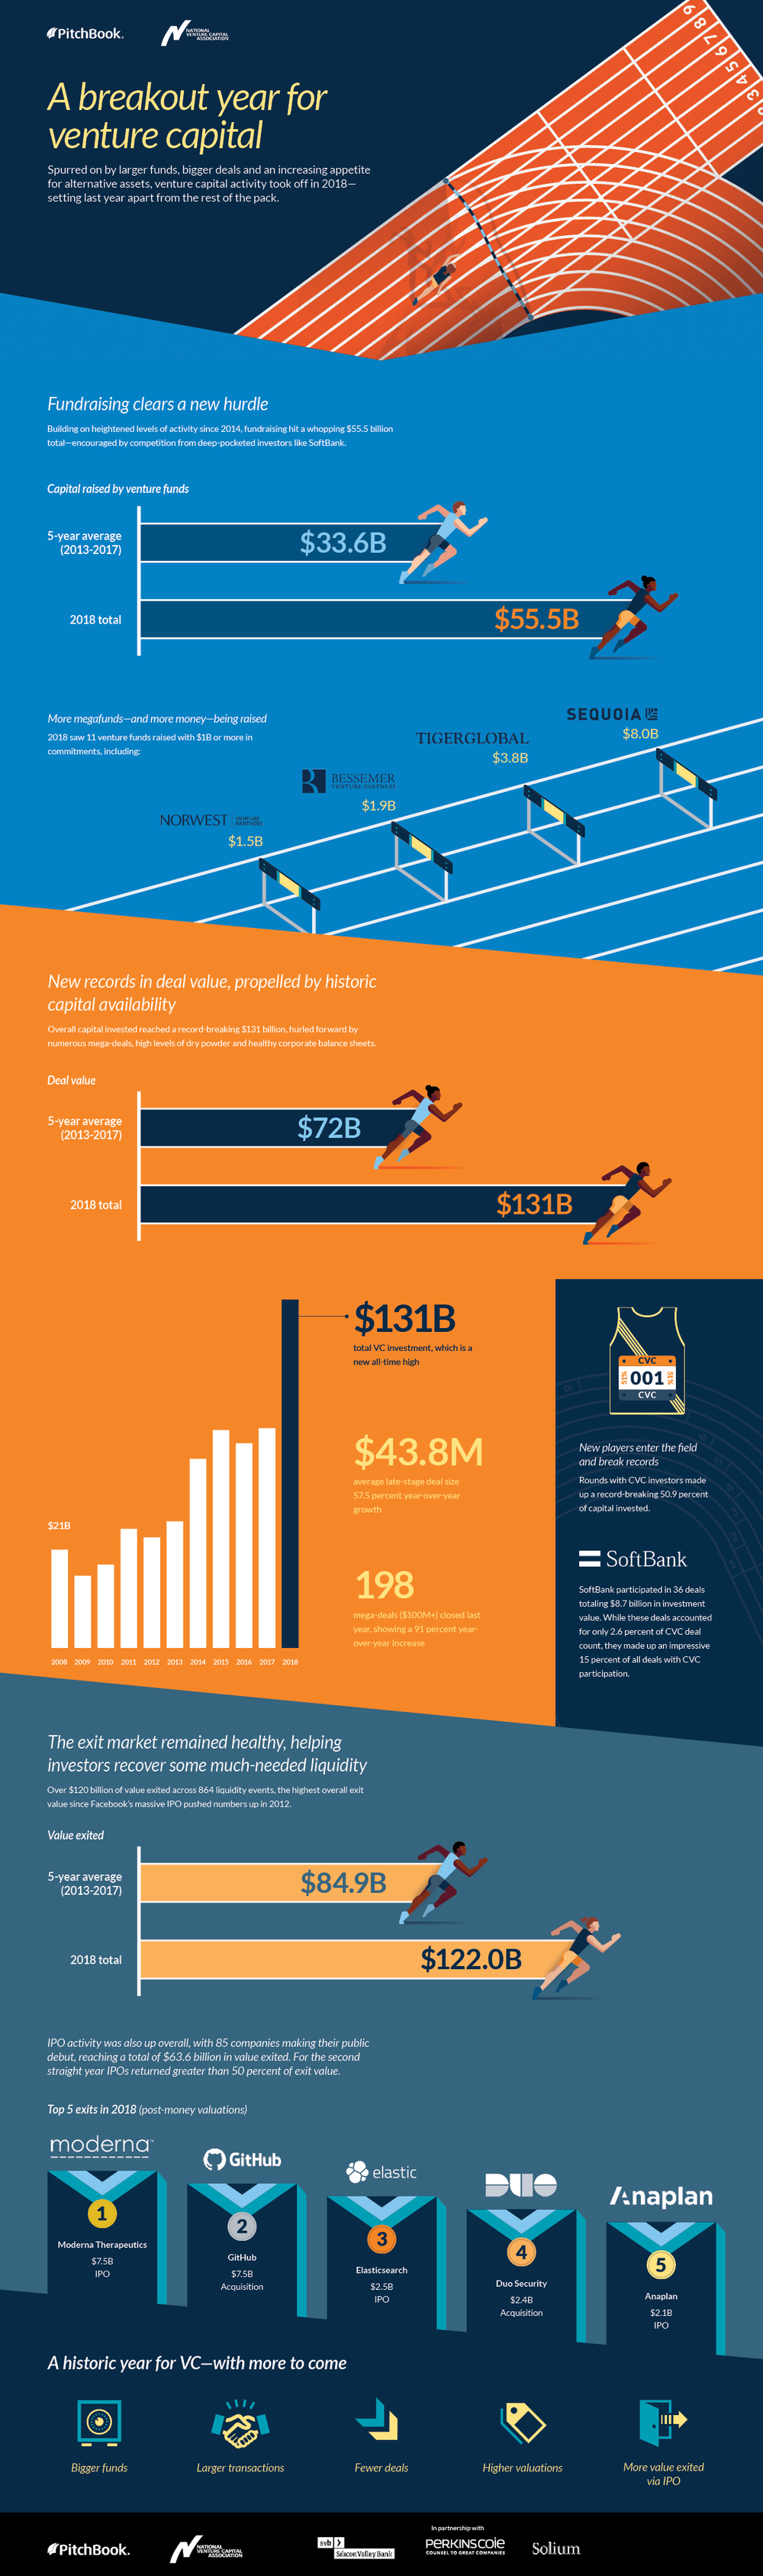
Each quarter, PitchBook publishes its Venture Monitor report, a comprehensive analysis of venture capital activity and market trends. The challenge for the Q4 2018 report was to distill hundreds of pages of research into a single companion infographic that would communicate the year's most significant insights in a way that was both engaging and accessible for a broad audience.
Approach
Working closely with PitchBook's Institutional Research team, PR team, copywriters, and multimedia specialists, we began by meeting directly with research analysts to better understand their report insights. These conversations helped identify the most meaningful trends and uncover the narrative that would anchor the visual story.
As a team, we developed the concept of "pulling away from the pack" to illustrate how venture capital activity in 2018 outperformed the previous five-year average. Collaborating with the copywriter, I translated that central theme into a cohesive visual narrative that connected key statistics, illustrations, and data visualizations into a single, easy-to-follow experience.
To extend the campaign beyond the report itself, I partnered with a Motion Designer to adapt the infographic into a series of short animated social assets.
Outcome
The final infographic served as the flagship visual companion to PitchBook's quarterly Venture Monitor report, helping readers quickly understand the year's defining venture capital trends through a clear, narrative-driven information design system. The supporting motion graphics expanded the reach of the research across social media.
Social promotion #1
Social promotion #2
Social promotion #3
Private Market Playbook
Challenge
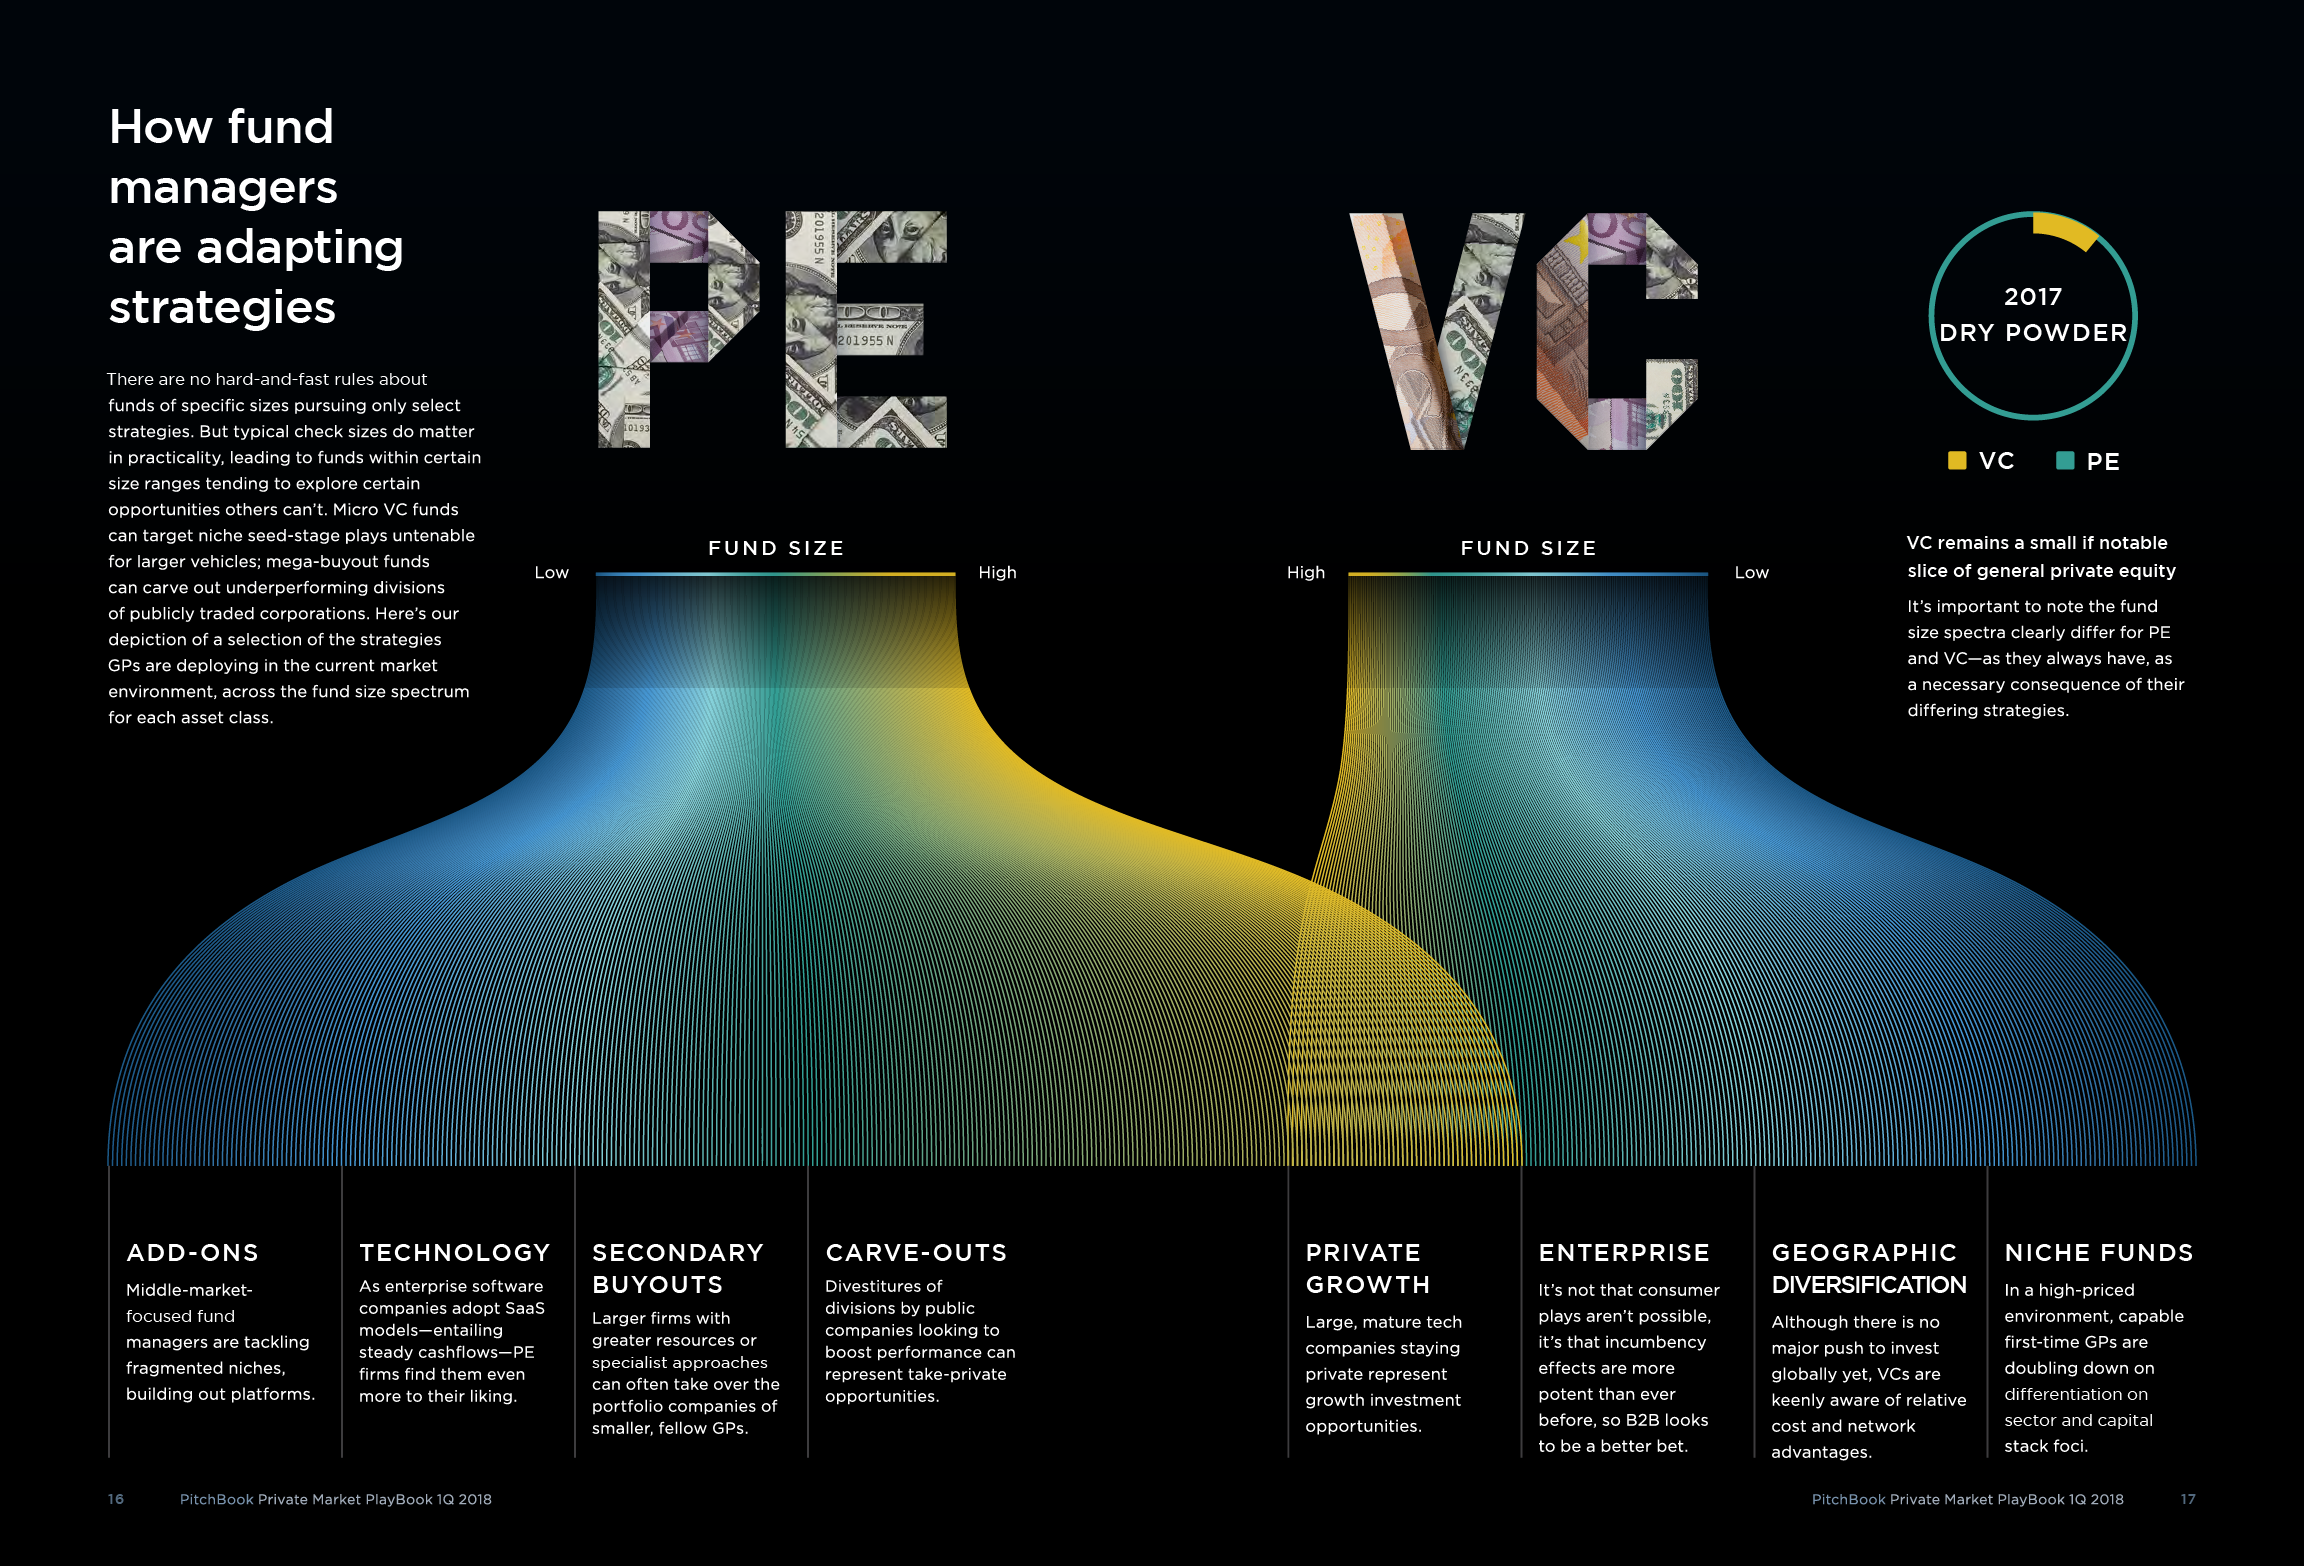
PitchBook's Private Market Playbook was a print publication exploring trends, terminology, and mechanics of the private capital ecosystem. The challenge for this infographic was to translate complex financial concepts into an engaging visual story that would complement the publication while remaining accessible to readers with varying levels of industry knowledge.
Approach
Working alongside PitchBook's in-house analysts and copywriters, we began by identifying key stories in the publication with the strongest narratives for an accompanying infographic. Close collaboration with subject matter experts ensured the visualizations accurately reflected the underlying data.
From there, I developed a visual layout that combined information hierarchy, illustration, and data visualization to guide readers through the content in a logical, easy-to-follow progression.
Outcome
The finished infographic became a visual companion to a feature story in the Private Market Playbook. It transformed complex research into an approachable editorial experience for readers.
iPhone X: Dealmaking & Design
Challenge
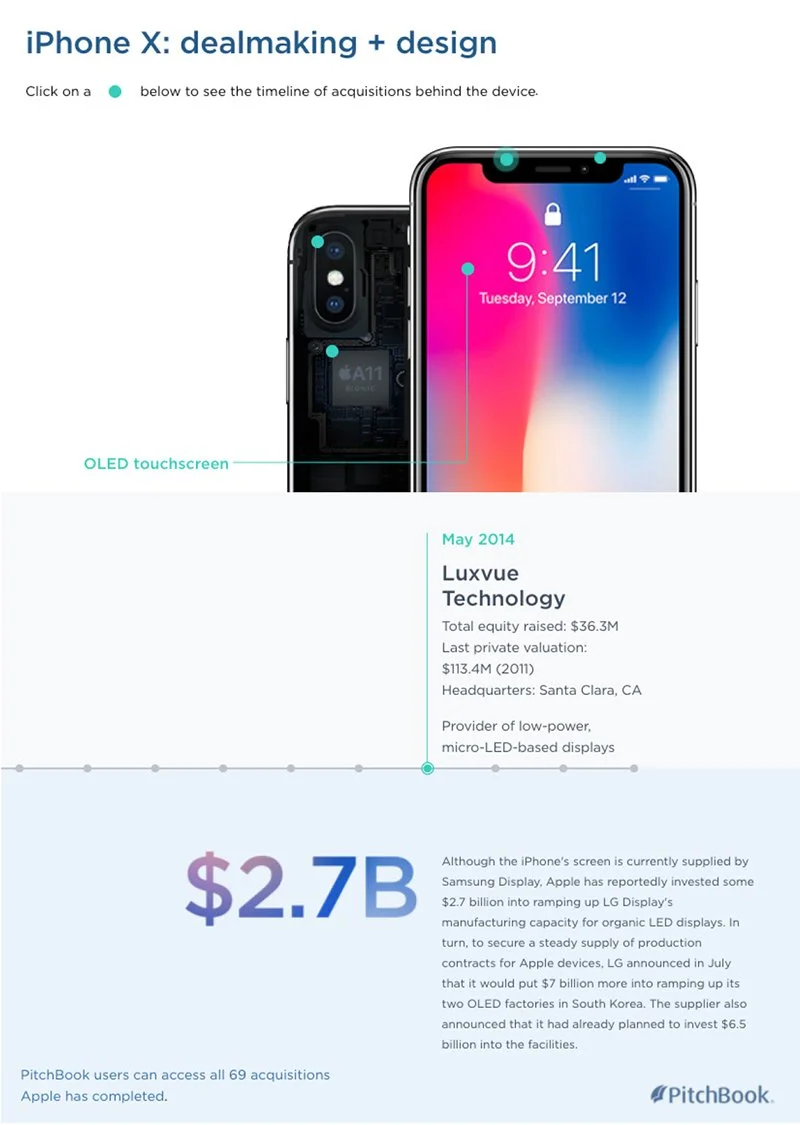
PitchBook's News & Analysis team regularly publishes editorial content that explores trends across the private markets. For this feature, the story examined the acquisitions that contributed to the technology behind Apple's iPhone X. The challenge was to transform a dense, text-heavy article into an interactive experience that would make the relationships between companies, acquisitions, and hardware components easier to understand and more engaging for readers.
Approach
Working closely with the article's author, we identified the story's core narrative and reimagined it as an interactive timeline. The experience was designed to visually connected key iPhone components to the companies Apple acquired to develop each technology chronologically. The interface guided readers through the history of the acquisitions and encouraged exploration.
Outcome
The finished interactive elevated the editorial feature with a richer, more immersive reading experience that made a complex topic more accessible. In addition to being featured within PitchBook's News & Analysis newsletter, the piece was adapted for the company's PR and social media channels, extending its reach and amplifying editorial content across multiple platforms.
PitchBook's 10-year anniversary animated infographic
Challenge
To celebrate PitchBook's 10-year anniversary, the creative team was tasked with developing a campaign that reflected on the company's growth while showcasing the depth and value of its proprietary data. Our team wanted to tell the story through the evolution of the private markets over the past decade instead of a traditional retrospective.
Approach
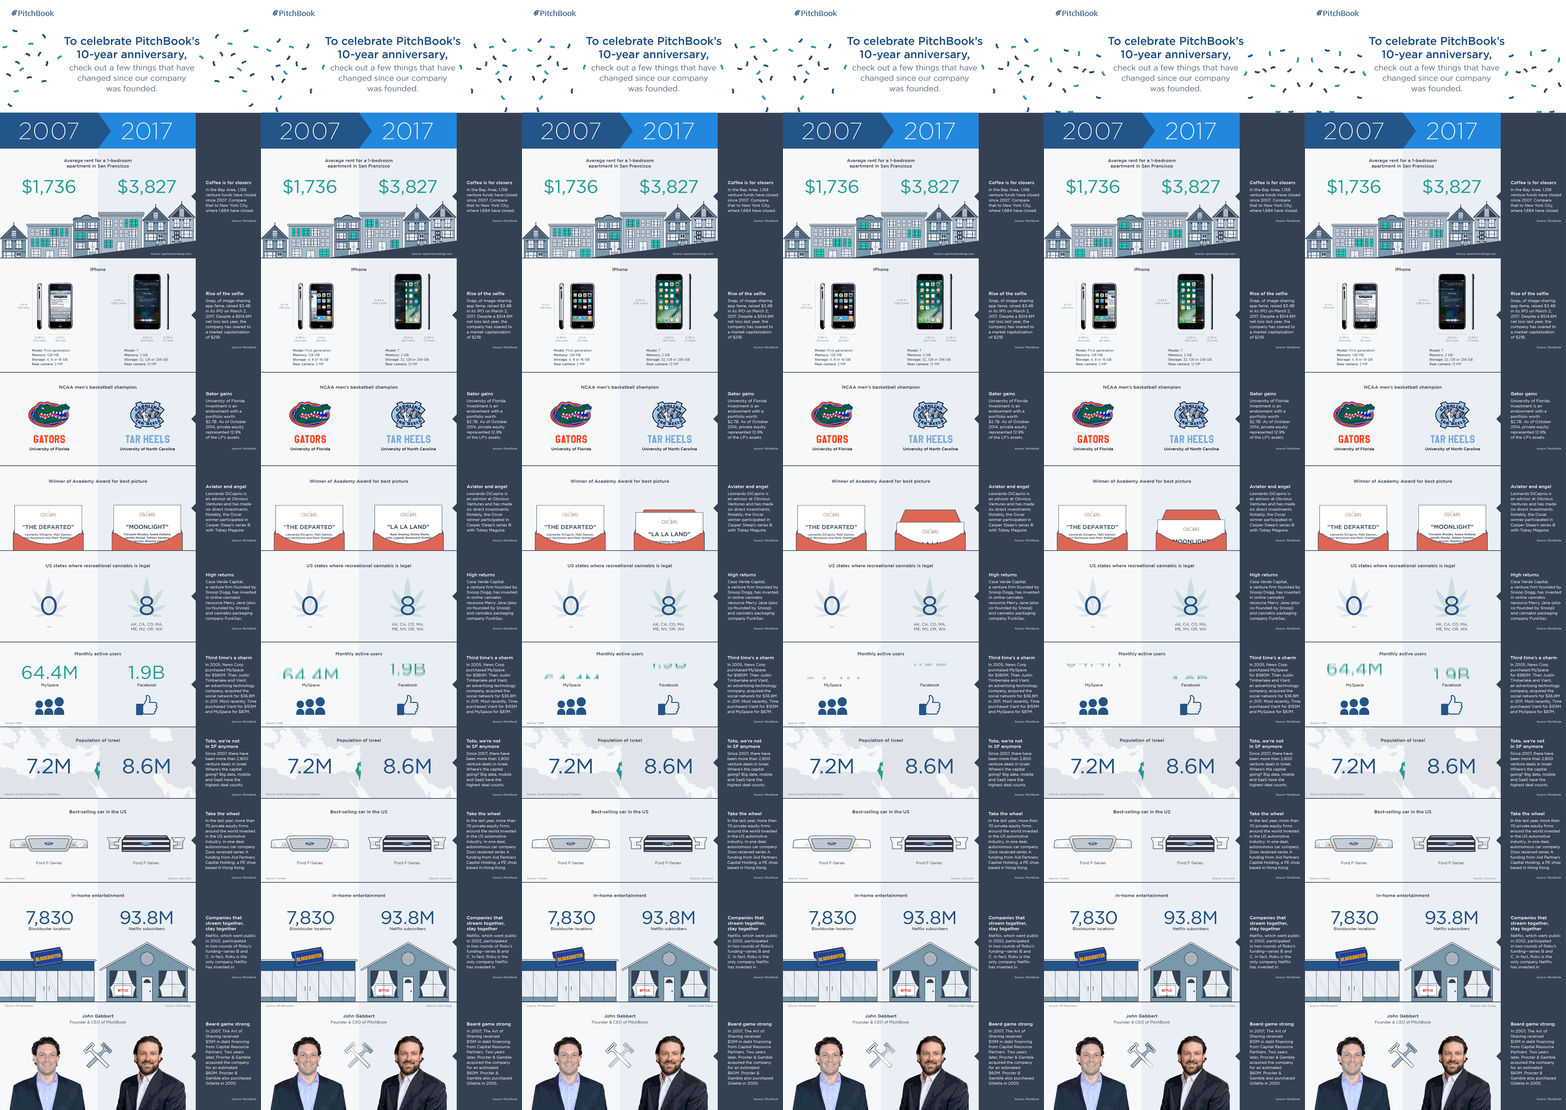
Our team explored several creative directions before landing on a concept built around side-by-side comparisons. Using PitchBook data across a variety of industries and verticals, we created a series of visual stories that contrasted market conditions from a decade earlier with the present day, illustrating just how dramatically the landscape had changed.
The design paired clear data visualization with synchronized motion, allowing each section to animate independently while looping seamlessly as a cohesive experience. This created a dynamic piece where viewers could explore the content from any point while maintaining visual continuity across the entire piece.
Outcome
The final experience transformed a company milestone into an engaging, data-driven narrative that celebrated PitchBook's history and the evolution of the private markets. The project showed how complex financial data could be communicated in a visually compelling and approachable format while reinforcing the value of PitchBook's research and data.